

Quantum Plasmonic Biosensor
Plasmonic biosensors are optical devices which make use of light to measure biochemical reaction between receptors and targets. Light is wave-particle in duality which means photons propagates as electromagnetic waves, so light itself shall be described by both amplitude and phase. With coherent, polarization and interference, we can further describe photon as Boson, a fundamental particle with spin of 1 in Quantum mechanics. Using monochromatic laser light as excitation, the most straightforward observation is the change of reflection intensity on targets binding to receptors. If broad spectra of white light are used, color change appears as energy transfer from incident photon to collective electron oscillation. The plasmonic energy transfer substantially alters the incident photon by both amplitude and phase.
With conventional intensity measurement, existing SPR system only measures the time averaged amplitude of reflected light on resonance, whereas the phase information is neglected. However, it is also known that the phase of incident light undergoes abrupt change on resonance with greater slope than that of intensity. So, by measuring the phase of light, it delivers better sensitivity. Unfortunately, the frequency of visible light is several hundreds of terahertz, therefore direct phase measurement with existing photodetector is impossible. To circumvent the problem, we adapted the interference approach to measure the phase of light by superposition of two copies of the incident light after traversing a prescribed optical path difference (OPD). The superposition of two copies of the light beam with spherical wavefront can be visualized in Figure 1 below.
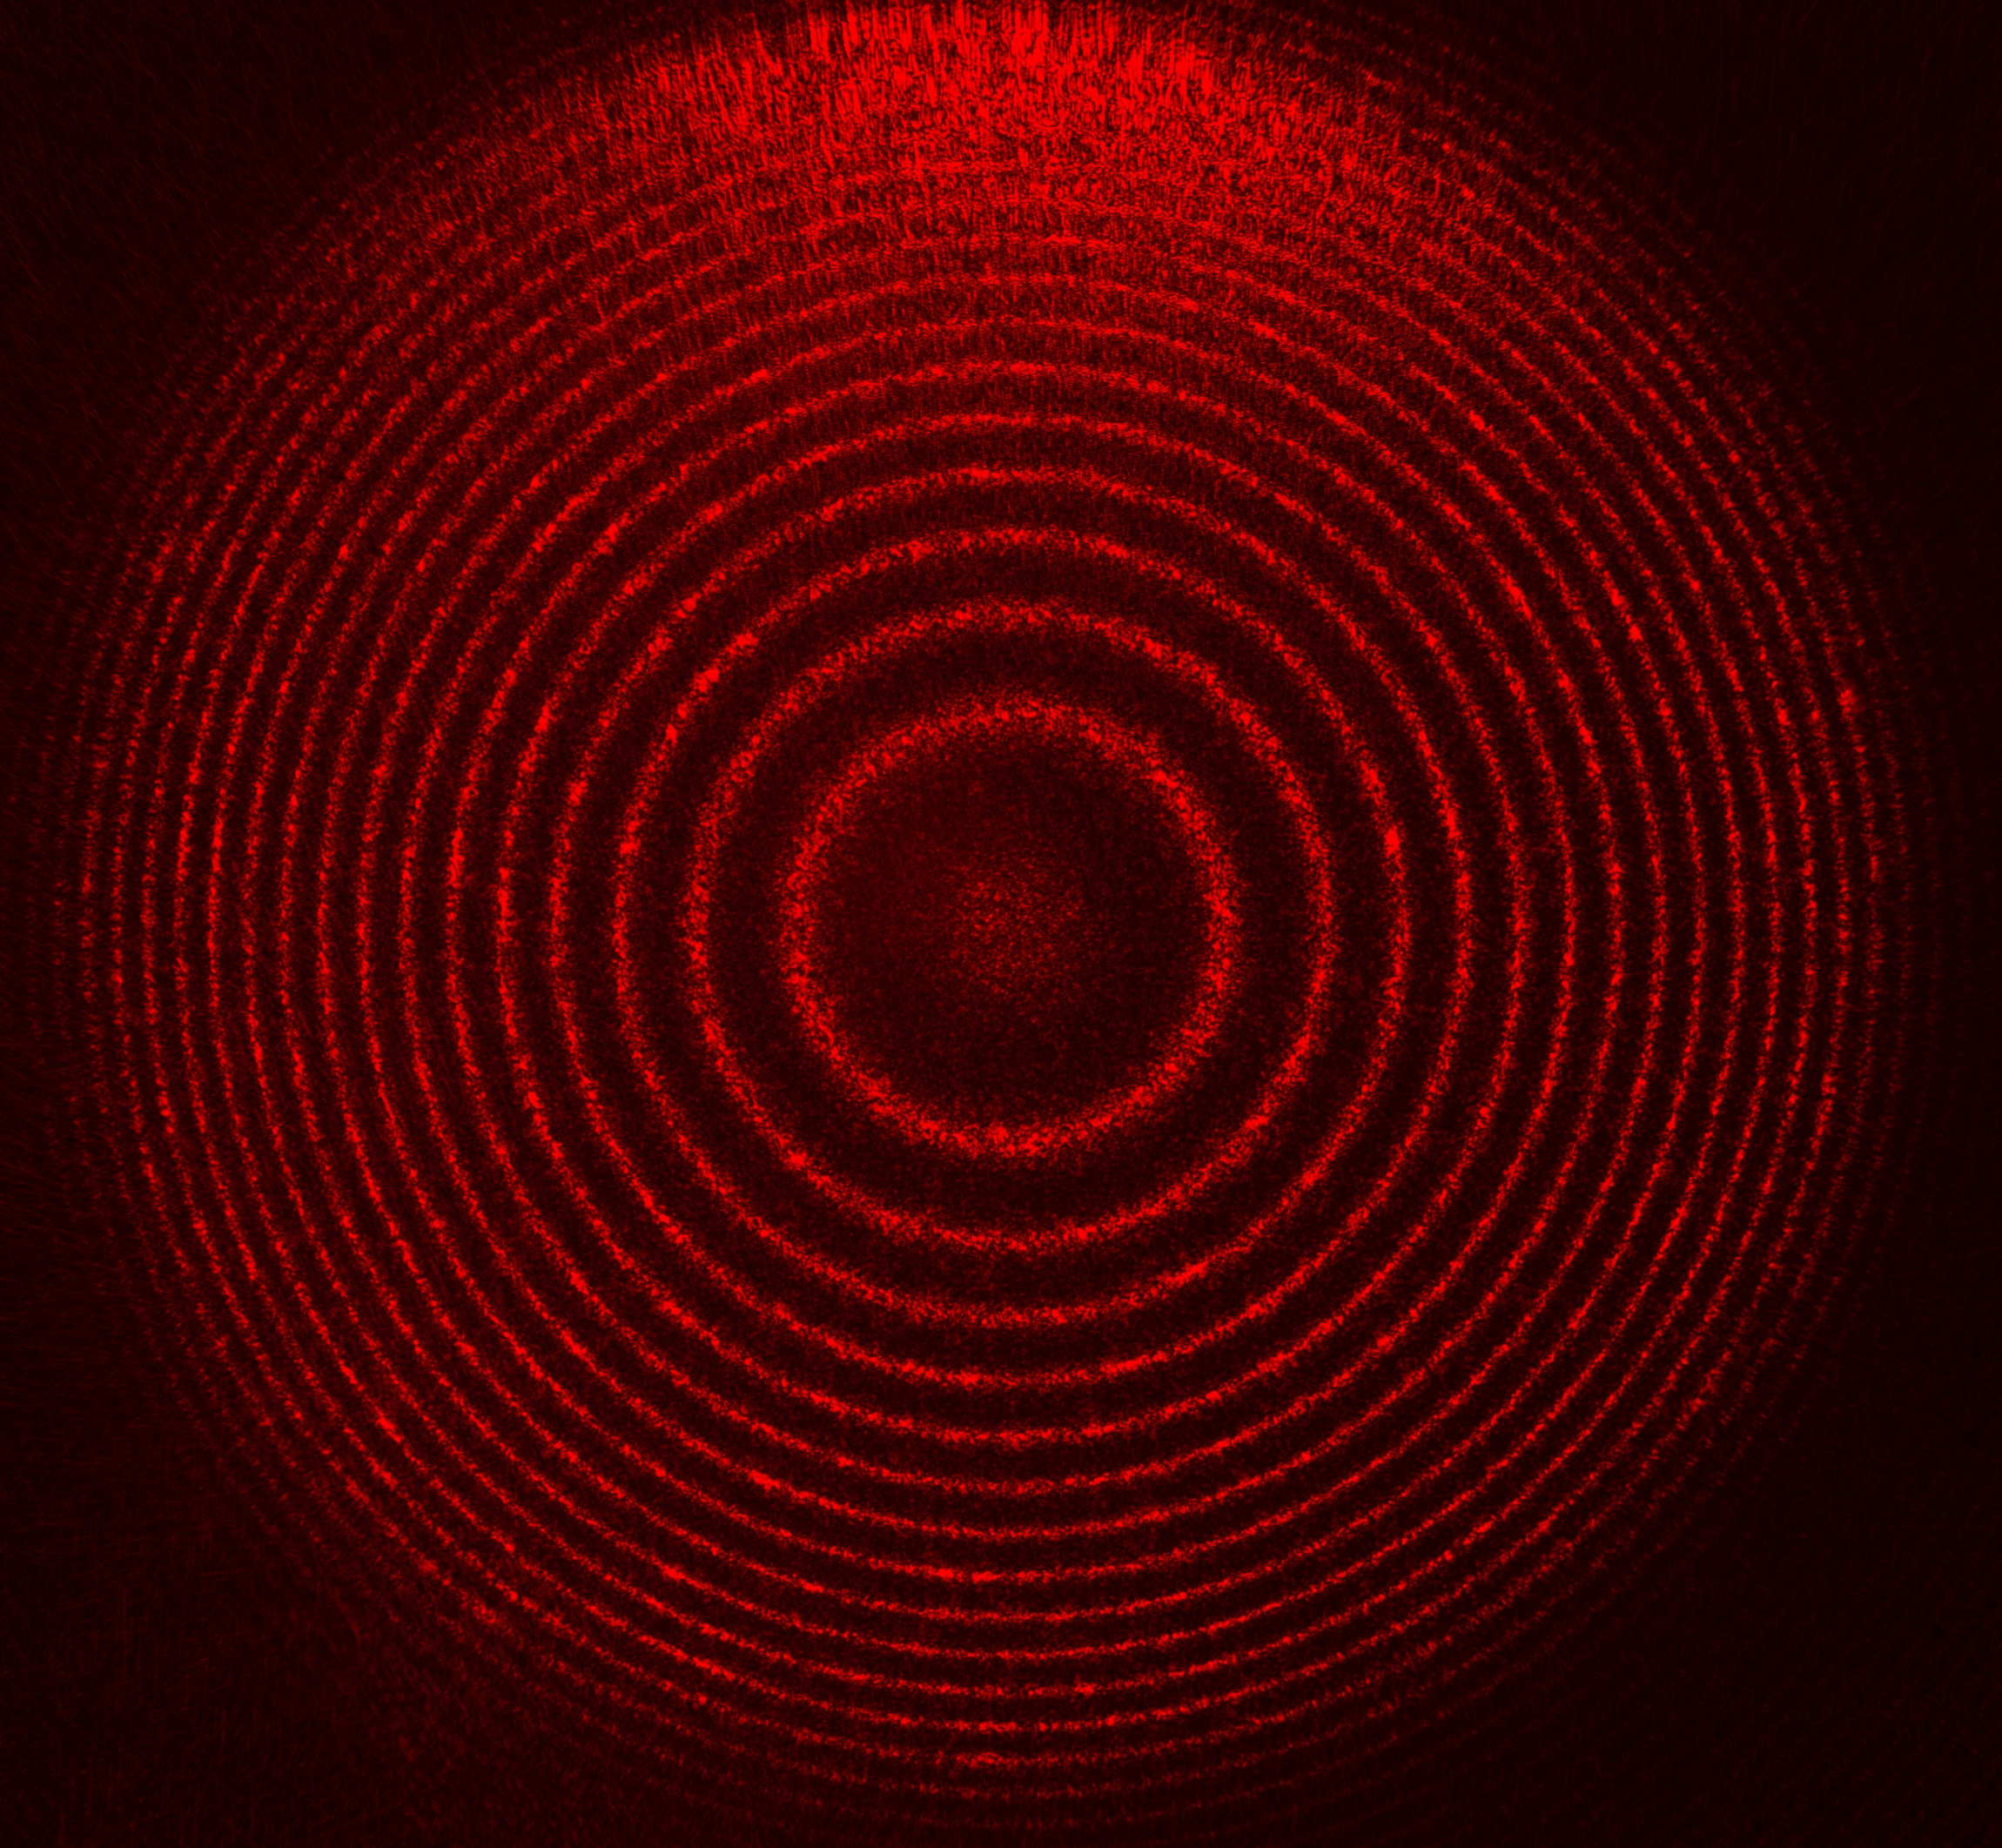 Figure 1. Interference of two spherical wavefront
The bright and dark fringes arise due to constructive and destructive interference of the two wave pockets with OPD of N to N/2 wavelength, where N is an integer. Since these two copies are spherical wavefront, the OPD of two adjacent pixels are much smaller than the wavelength. Therefore, bright and dark fringes can be visually observed on the image. To further elucidate the interference of spherical wavefronts, it is better to refer to the phenomena of two points interference in Figure 2.
 Figure 2. Interference of two point source
The interference of two points can be described in by the following equations, where ![]() is the position vector, t is time, A is the amplitude, k is the wavenumber, w is the angular frequency and φ is the phase difference of the two waves in radians.
is the position vector, t is time, A is the amplitude, k is the wavenumber, w is the angular frequency and φ is the phase difference of the two waves in radians.
![]()
![]()

Therefore, if the phase difference is an even multiple of π, the sum of two waves becomes a wave with twice the amplitude, which is constructive interference.
![]() .
.
If the If the phase difference is an odd multiple of π, the sum of two waves becomes zeros, which is destructive interference.
![]() .
.
As stated previously, frequency of visible light is too high to be directly resolved by existing photodetector. The intensity of the light at a given point is proportional to the square of the average amplitude of the wave. So, the interference intensity recorded on the image plane can be expressed as, where r is a position vector

We can further simplified the above equation as I = A + B cos (φ), where I is the pixel-wise intensity, A is the background, B is the mean and φ is the phase.
With LSPR scattering of TiN nanocubes, and the roughness of 3D printed biochip exceeds 638nm laser wavelength, speckles are observed on the image plane rather than fringe patterns. This is due to the random initial phase produced by scattering and surface roughness. The interference equation is modified to cater the random initial phase ϵ, which becomes I = A + B cos (φ + ϵ). The interference image of our biochip is shown in Figure 3. One of the most challenging aspects of our system is to develop efficient hardware actuator and software algorithms to retrieved the pixel-wise phase information from the speckle image. Fortunately, biochemistry reaction is usually slow in the scale of seconds, therefore we can adapt phase-shift algorithm to compute the phase of the speckle image. Therefore the entire image plane of the digital camera becomes a massive array of parallel channels for LSPR biosensing. With 4K resolution, we would have over 12 million parallel channels in theory. However in practice, we are limited by the resolution of 3D printing and droplet dispensing. Therefore, we arrived at 12 by 12 microarray at the initial release, but this is already a substantial improvement over existing SPR systems.
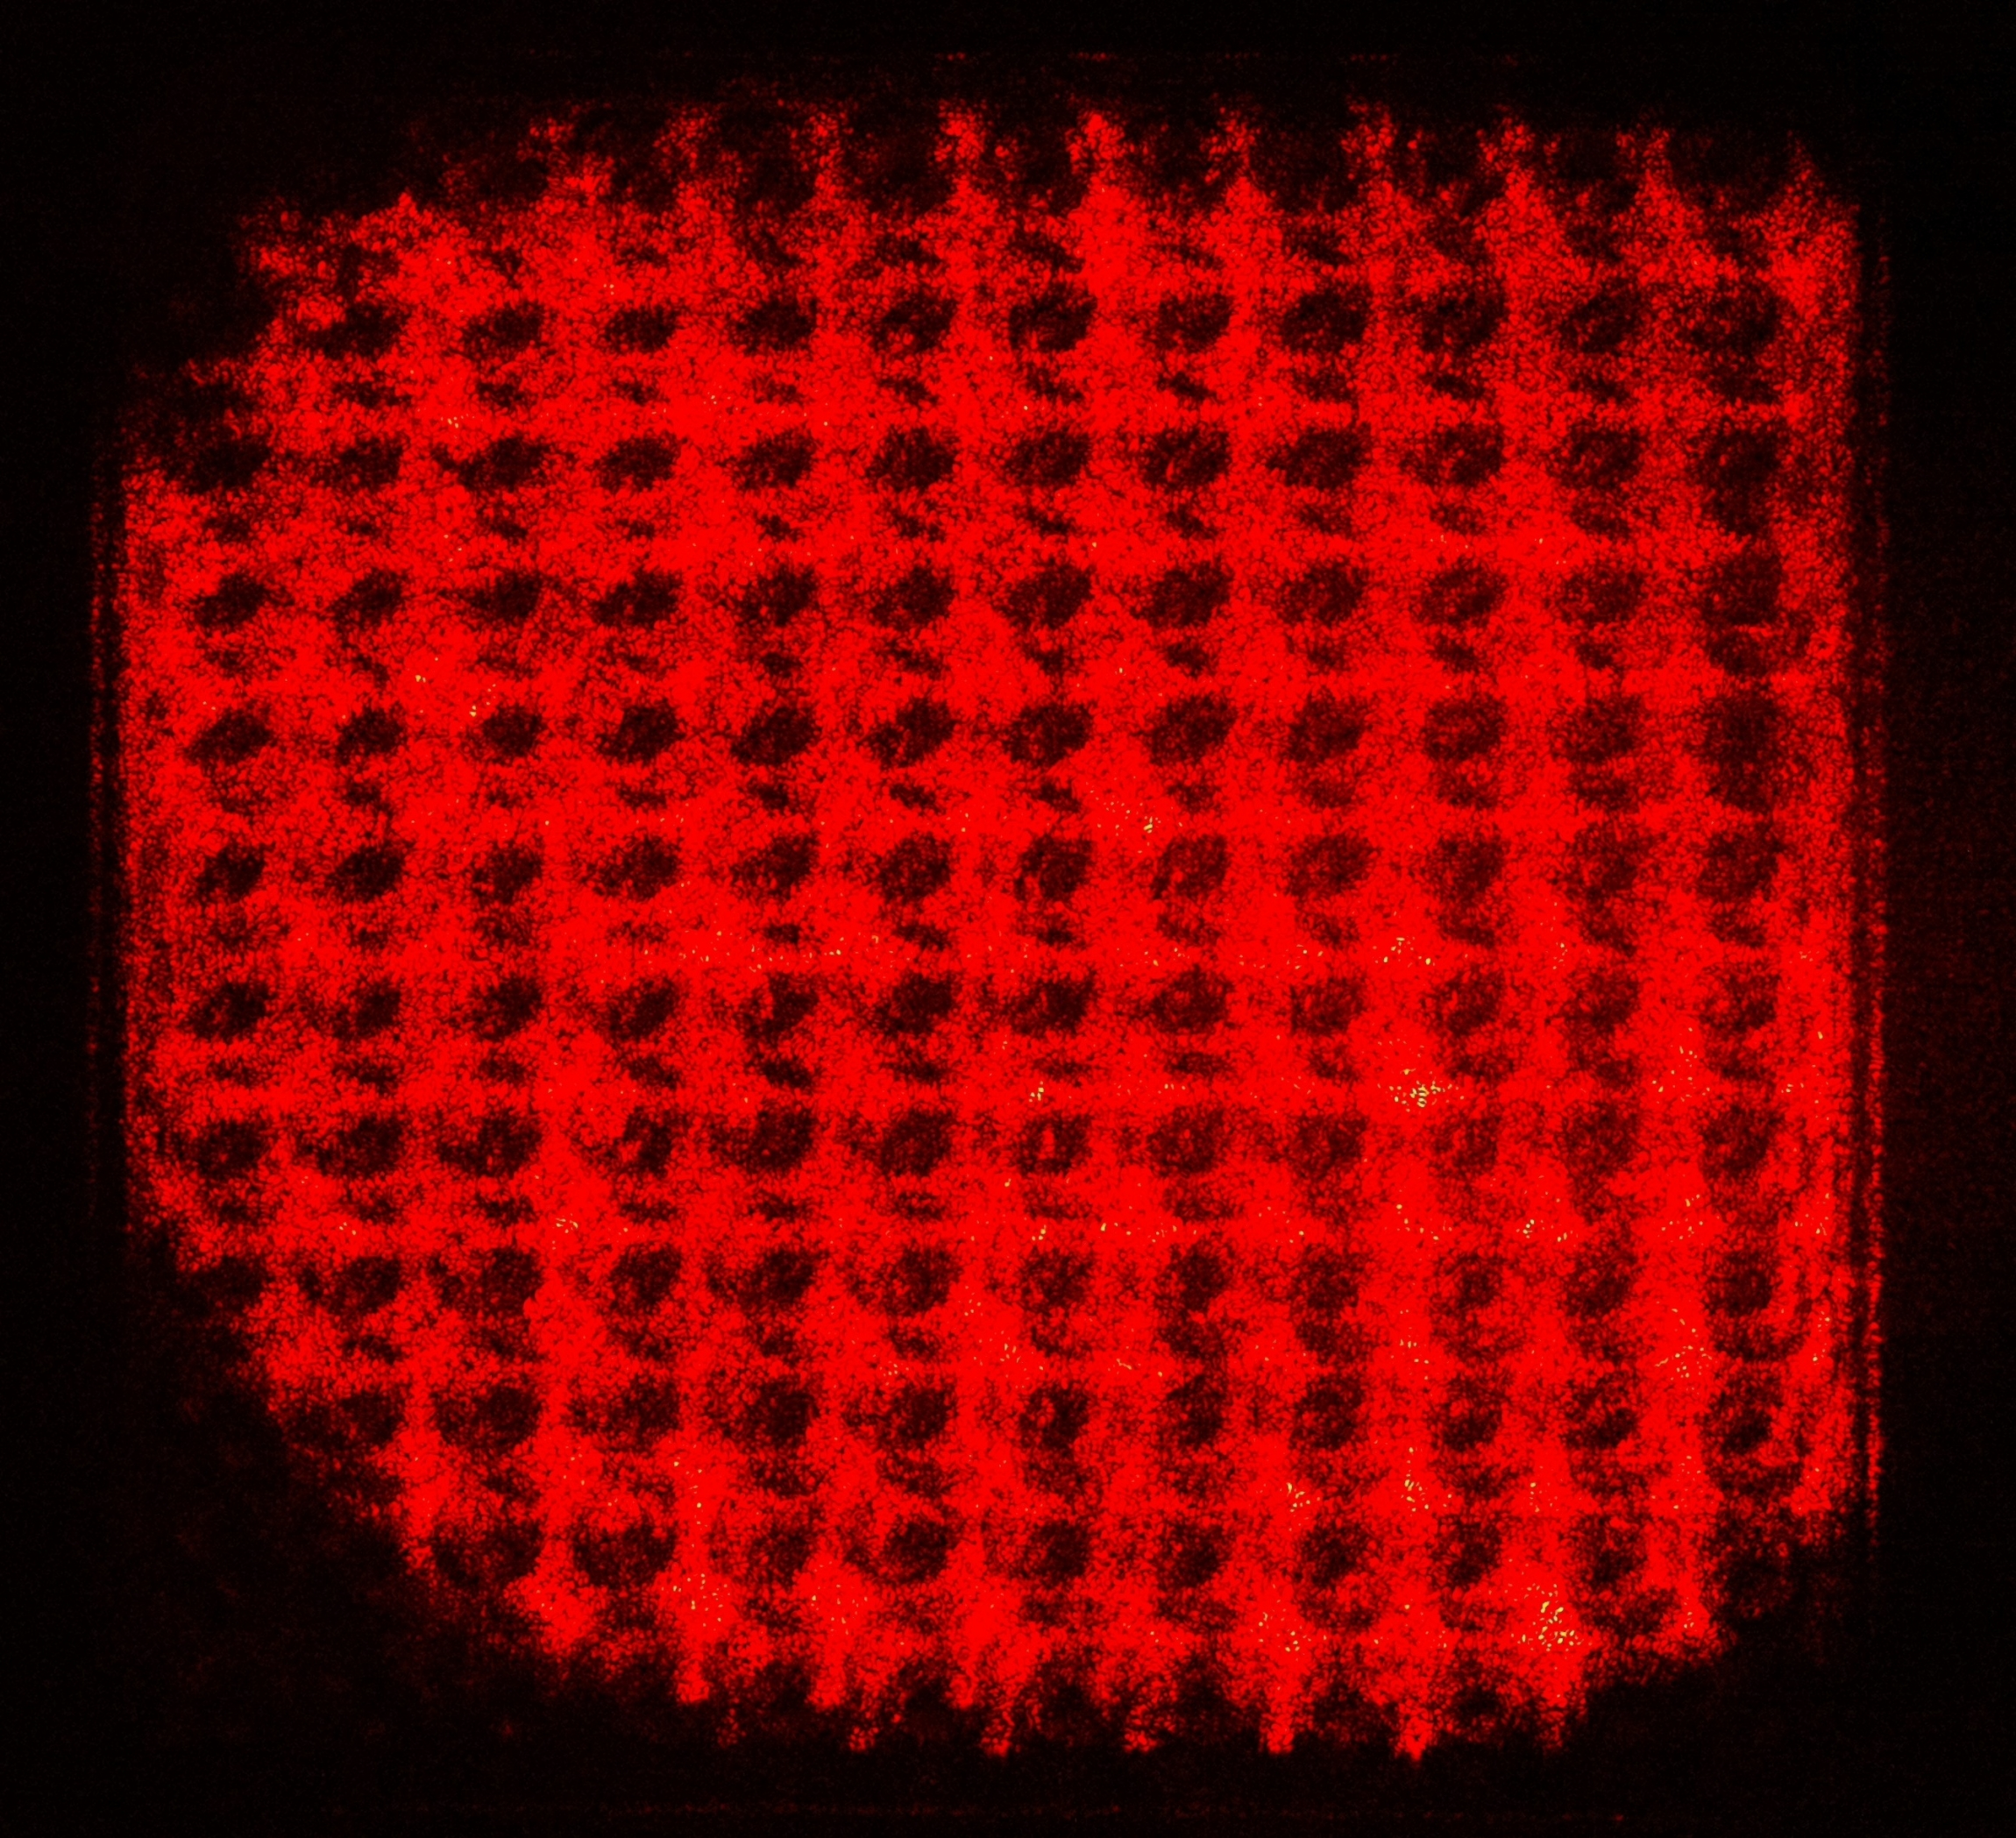 Figure 3. Speckle image of our LSPR biosensor with TiN nanotechnology
As you can see in Figure 3 above, it is quite different from Figure 1. Do we still have interference at all? The answer is yes, as long as the OPD is shorter than the coherent length of the laser source, interference persists. Since our single mode laser diode is temperature controlled and thermally stabilized to 1/1,000 degree Celsius, interference shall preserve. To show interference effect, we deliberately alter the OPD step by step in the system, and we take every image after modification. Doing so, we can retrieve pixel-wise multiple oscillations from a series of speckle images. These are the interference signal we are looking for. Some of these pixel-wise oscillations are shown in Figure 4 below. The initial phase of every pixel differs, so they appear to have been phase-shifted from peak to valley.
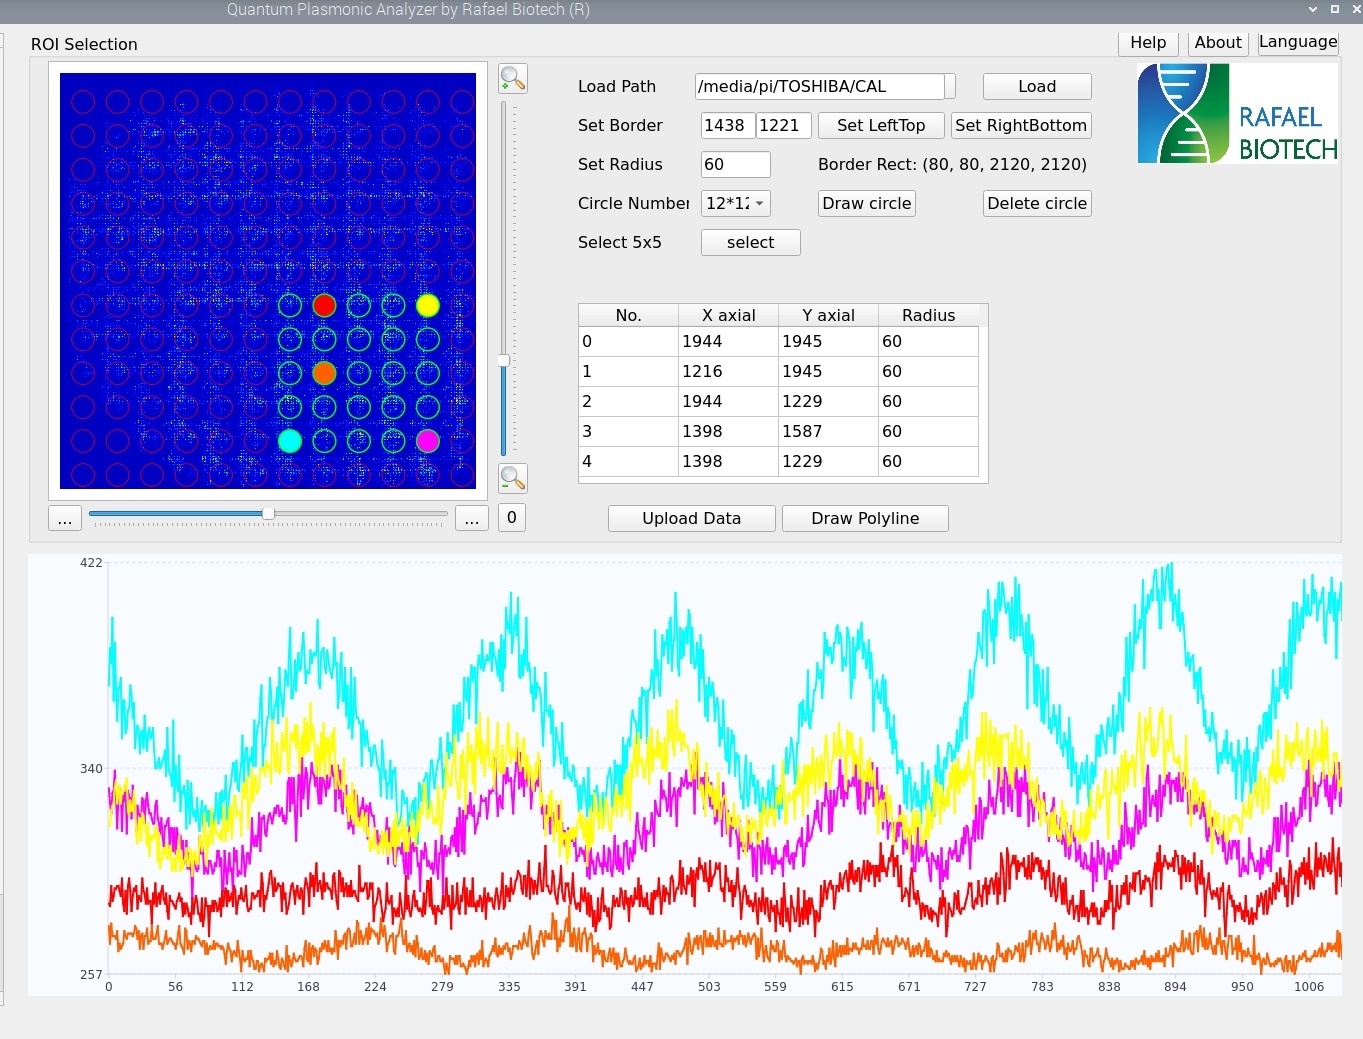 Figure 4. Pixel-wise multiple oscillations from speckle images
After being convinced that interference preserves, we performed phase shifting calibration to our system. Then we perform a simple biochemical experiment with typical Biotin-Streptavidin binding and measure the phase response in real-time. Here are the details. At first, we rinsed the biochip with PBS buffer, then injected 100ug/mL Biotin and waited for 20 minutes, then rinsed with PBS buffer to establish the baseline. After that 10nM of Streptavidin was injected and waited for 20 minutes, then rinsed with PBS buffer to confirm the Biotin-Streptavidin interaction. The final phase after Biotin-Streptavidin binding increases substantially from the initial value. As Biotin-Streptavidin is well known for high binding affinity, it is obvious that our LSPR biosensor with TiN nanotechnology is capable of measuring such biochemical interaction. Experimental data is shown in Figure 5 below.
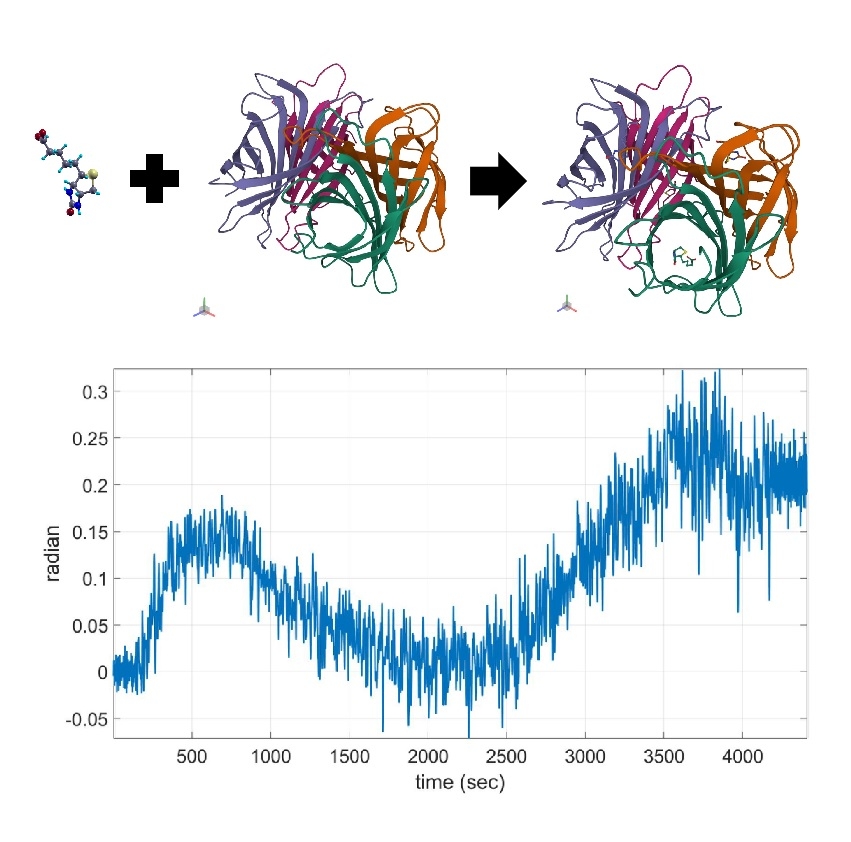 Figure 5. Binding of Biotin-Streptavidin measured by the TiN biochip
