

Software
Data Analysis Software
Existing commercial SPR systems usually measure the reflection intensity of the sensing chip or optical fiber tip. Even though there are multiple sensing spots on the chip, the reflection from one spot is acquired as a single accumulated signal. This is particular true for planar gold film based SPR systems which normally assumes unifrom response on receptor-target binding. However, as the target concentration goes to attomolar level, which means only few copies of target per spot. It is no longer appropriate to assume uniform refractive index change over the entire sensing spot. Therefore, data analysis algorithm must be reinvented to tackle such problem. Since we employ CMOS array sensor as camera to capture data, it is rational to adopt pixel-wise processing routine to resolve the issue.
Besides, our QPLoC biosensor is made by 3D printing and the locations of TiN nanocubes on the biochip surface are rather random. Therefore, it is no longer appropriated to assume uniform response from the microwells for attomolar level biosensing. Thus, we introduce pixel-wise data processing routine to our data analysis software. The logic of our data analysis routine is fairly simple:
- load all frames of the experiment in sequence into the PC workstation memory,
- input the center of the microwell to be analyzed and calculated the vertical and horizontal coordinates of all pixels within the microwell (approximately 8,000 pixels for microwell of 100 pixels in diameter),
- for each pixel above, extract the history raw dataset then use B-splined curve fitting to obtain a low-pass result for each dataset,
- from the result of (3) find the maximum and minimum of the phase change along time domain, and also identify the position of the maximum and minimum,
- from (4) calculate the phase difference between maximum and minimum, and check that if the separation between maximum and minimum is sufficient. If the separation is too short, then the phase difference calculated is invalid due to pixel instability. Otherwise, phase difference is valid and retained,
- repeat (3) to (4) for all pixels within the microwell and reconstruct the 2D phase map for all pixels with valid phase change. For pixels with invalid phase data, the phase value is adjusted to zero,
- from the reconstructed 2D phase map, calculated the mean and standard deviation to signify the biosensing performance.
Since each raw frames consumes about 20Mbytes of memory and there are 800 frames for each experiment, it needs to 16Gbytes of memory to store all raw frames. Of course, for experiments with longer duration, extra memory is required. With modern PC workstations, the pixel-wise calculation for each microwell is very fast and it takes less a second to process 800 frames. Open-source analysis routine library are currently used for our system, these includes OpenCV [1], GNU Scientific Library [2], and the graphical user interface was developed in Qt® [3] under the small business license.
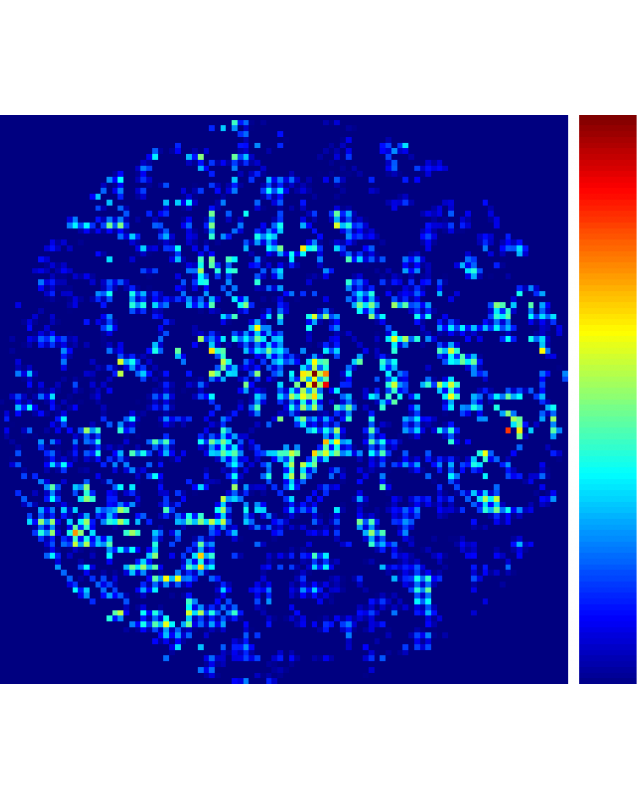
Typical results of our analysis software are given below. Figure 1 shows the phasemap at a particular microwell. It is a CRP positive serum at atto-molar concentration. The mean value of phase map is about 0.20 radian. Whereas Figure 2 shows the phasemap of same microwell with CRP negative serum with the same number of repeated dilution. The mean value is only 0.07 radian.
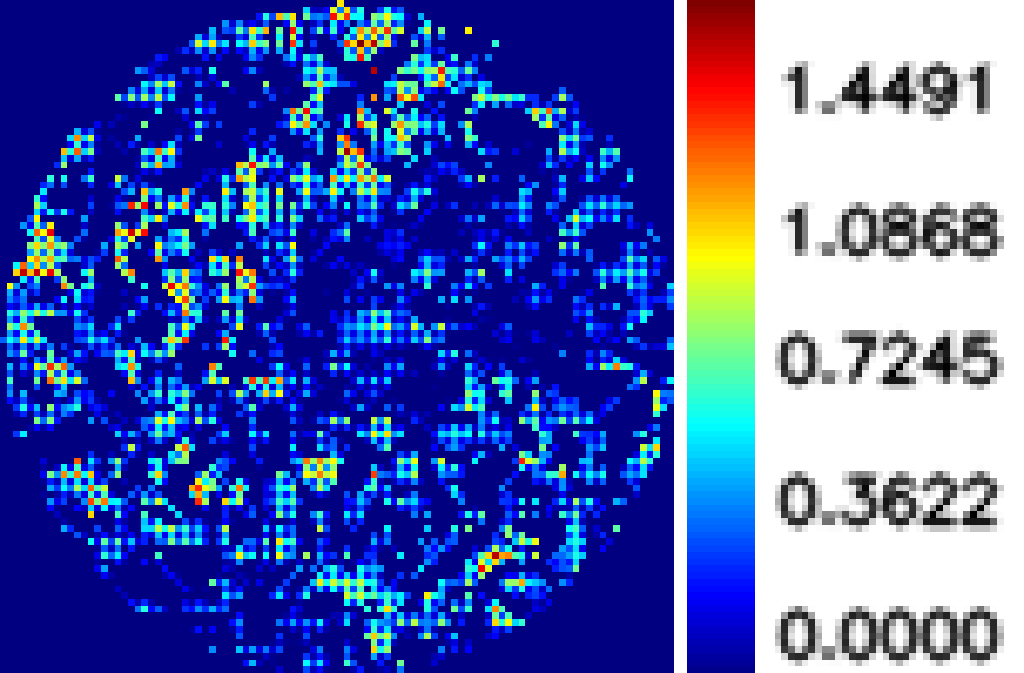
CRP positive serum with mean to 0.20 radian
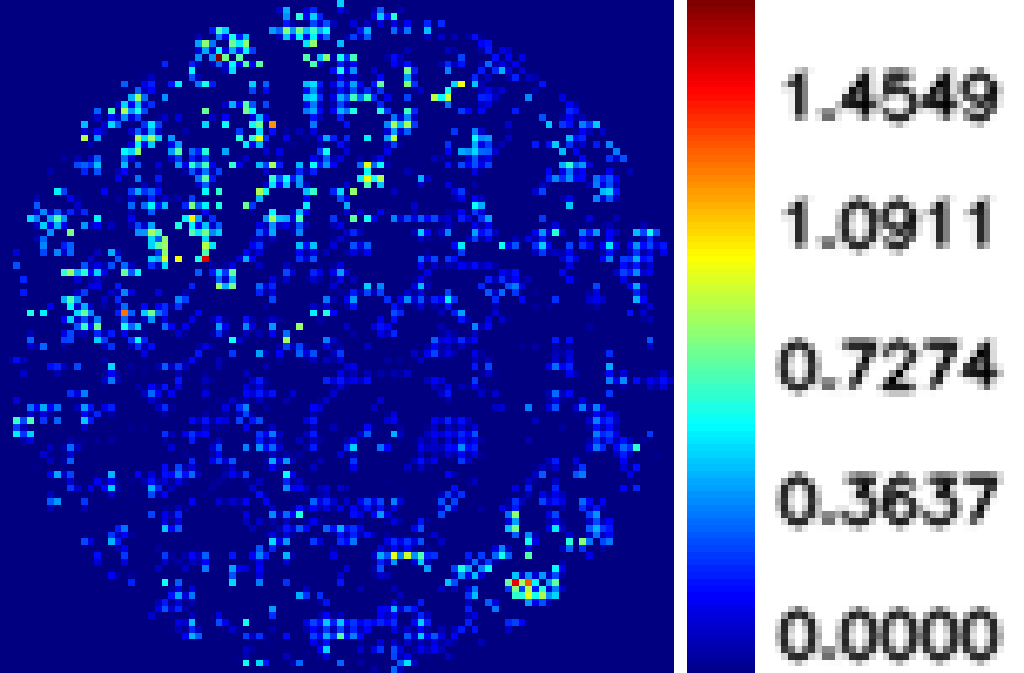
CRP negative serum with mean to 0.07 radian
Reference
[1] OpenCV, https://opencv.org/
[2] GNU Scientifc Library, https://www.gnu.org/software/gsl/
[3] Qt, https://www.qt.io/